When we started 2023, SQLFluff was just about to release 2.0.0 , and it was slow. We knew it was slow because we had several issues like this one:

Most of the focus of getting to 2.0.0 was on accuracy and robustness, however much of the focus since has been on performance and speed. This post is a little peek behind the curtain of how we went about that, and what some of the biggest improvements have been.
Getting oriented on performance#
At the start of the year we know that things were slow, but we needed to
understand how slow and also what influenced that performance. For some time
there has been the ability to measure the total runtime of SQLFluff by using the
--bench
option, but we also introduced the --persist-timing
option which allowed the user to offload a more details csv file of the
file-by-file timings for each step in the process. Using that option we can plot
time spent against various steps in the linting process for all of the files in
a large project. The output includes the “length” of the file in both characters
and segments (the tokenised elements of a SQL file), and the most useful proxy
for duration was (perhaps unsurprisingly) the length of the templated file in
characters (i.e. the length of the file post-rendering by jinja or similar).
Here’s what that looks like for the tails.com dbt project, running with these
options using SQLFluff 1.0.0:
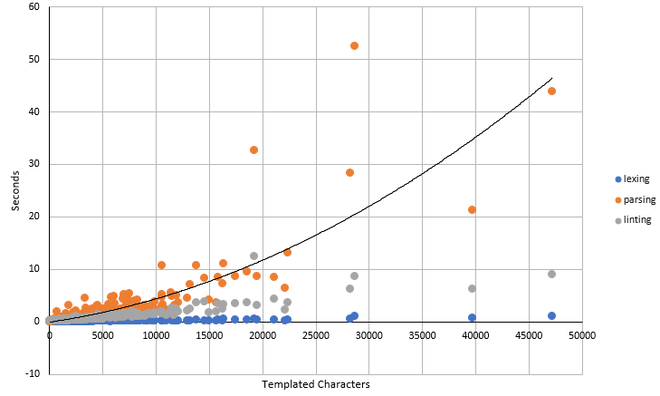
There are two things to note from this chart:
- Performance is roughly linear with file size. For illustrative purposes, the chart shows a polynomial trendline for the parsing performance, but it’s not very far from a straight line. Additionally, the y-intercept of this curve is roughly zero. This leads to the conclusion that we can characterise performance with a simple ratio: seconds per templated character.
- While SQLFluff has four distinct stages
in the linting process, however two of them dominate the runtime of linting:
- “Templating” (perhaps more accurately “rendering”), isn’t shown on this chart. Time spent in this step is effectively trivial.
- “Lexing”, as shown on the chart in blue is very minimal compared to the others.
- “Parsing”, shown in orange, is the performance bottleneck at 1.0.0.
- “Linting”, shown in grey, is a close second place with a similar magnitude of runtimes.
This brings our focus going forward onto those last two steps of the process and on their performance in seconds per templated character.
Ongoing measurement#
For much of this year, the primary way of getting a feel of whether performance has been improving as been ad-hoc analyses like the one above. This is clearly very time consuming and difficult to use as a monitoring mechanism. We’ve taken two distinct steps to get better at this.
The first (and easiest) was to ingest the existing data from our CI pipelines (this was pretty accessible using the GitHub connector from Airbyte). This isn’t perfect, because there are lots of other influences, but for the most part, our CI runtimes do correlate fairly strongly with SQLFluff performance. Here’s what that looks like for the last 6 months:
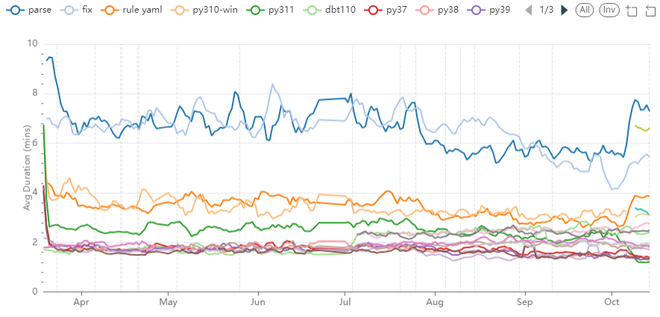
This chart shows a large drop around March, followed by a steady improvement from August through to October. However the big issue in reading this chart is that it’s very noisy, and there’s also a big slowdown in October, which is caused by changing our CI pipelines from python 3.11 to 3.12. Clearly there was a need for something more robust.
Our partnership with the folks at datacoves.com has given us access to some beefier data warehouse and automation capacity. We’ve used this to set up a daily Airflow task which runs a full linting job for the current head git commit on that day, storing the detailed timing results in Snowflake (we’ve also kept the environment and other factors as constant as possible in the process). That means we can more accurately plot performance, in a more robust and isolated way than using raw CI logs.
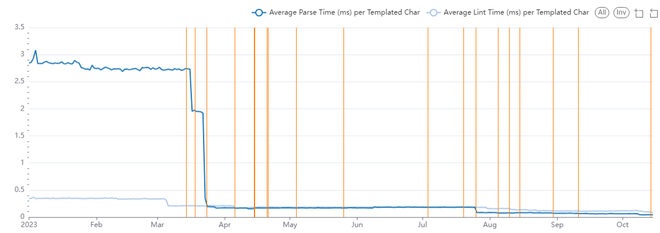
This really clearly shows how performance has changed over time, and highlights some really clear step changes that have been made, it also really highlights just how far we’ve come so far. It also highlights how poor the CI timings were as a way of estimating true performance! As at time of writing (just after the release of 2.3.3), parsing time is now 1.1% of what is was in January 2023 and linting time is 26.7% of what it was in January 2023. That’s a ~4x improvement in linting and a ~100x improvement in parsing!
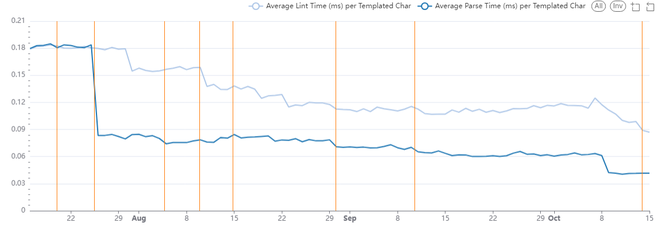
Zooming into the last three months we can see continued improvements, which on a relative scale are still fairly meaningful.
Big Wins#
Some of the big wins along the way have been:
- Back in March we saw a reasonable step improvement in linting times by reducing duplication in our rules as part of the recoding for 2.0.0 .
- The largest improvement in parsing times (on an absolute level) was the rethink of caching in the parsing engine (a.k.a. Parse Caching ). There had been an attempt at caching within the parser before, but this much more robust approach we much more effective.
- In late July we were able to reduce the amount of object copying in the parser . In the past there hadn’t been good isolation around the segment copy method, and so we’d been copying more than we needed to as a way of catching bugs. Better robustness through the rest of the codebase now meant we could be more specific in the copy method and avoid the making and re-making of segment objects, which almost halved parsing times.
- Off the back of some of the optimisations opened up by better robustness
across the rest of the codebase, we started working toward enabling
--strictmypy. Ideally we were hoping to be able to utilise mypyc , which wasn’t possible in the end, but the necessary refactoring along the way led to identifying some significant optimisation of select analysis utilities in August, which are used by several rules. - “Single pass parsing” was one of the aims in September, further aiming to reduce the amount of segment manipulation, culminating with the rework of MatchResult . In many ways this was the spiritual successor to the work from July where we reduced the amount of segment manipulation, by deferring all segment manipulation to the end of the parsing phase.
- Various rule performance improvements in October, notably caching the hash method of segment , and streamlining segment comparison .
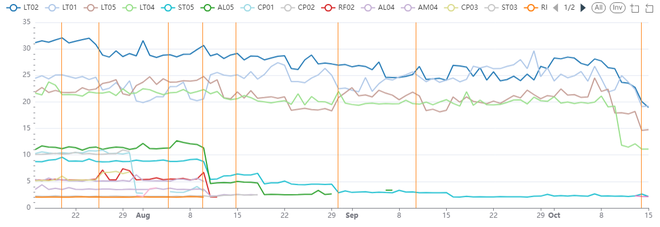
Those latter gains in rule performance are most visible when we look at the per rule performance statistics. Although that also highlights that overall rule performance fluctuates more, with some occasional changes making some rules slower and other rules faster. The select Analysis rules are most obvious here as their runtimes plummet around the 10th of August.
What next?#
Today (16th October 2023), linting is the bottleneck (by a factor of ~2), and that’s primarily made up of the runtimes of four rules ( LT01 , LT02 , LT04 & LT05 ). All of these are based on our reflow utilities, and so that seems by far the most obvious place to continue work. That’s especially true given most of the focus for that portion of the codebase has been on accuracy and not on performance, which means there might be some easy wins in there.
If we can make significant progress on reflow, then quite quickly, parsing may once again become the bottleneck - and that presents a harder challenge given so much work has already been done there.
What did we learn?#
Working on performance is hard. Partly because it just takes a lot of effort, but also because it’s a very different skillset and activity. As you’ll see above, our standard CI suite, which was great for ensuring functionality, was fairly unhelpful for tracking performance and we needed a different set of metrics and measurement to make meaningful progress. It also presents challenges for the way you and your team work. Reviewing and performance and functionality changes can feel quite different - and doubly so if you try to do both at the same time (which I wouldn’t recommend).
On a more practical note, using tools like the python profiler and snakeviz , have been invaluable in understanding where time is being spent. In particular using them on sections of the parsing operation (i.e. using the SQLFluff python API to run separate profiling operations for parsing and for linting steps - especially combined with limiting a run to only a small subset of rules) has been one of the breakthrough workflow improvements to really making progress.
I think a good point to end on however is the link we’ve found between code quality and performance. Often the first step in improving the performance of a section of SQLFluff was to streamline the flow of the code, improve test coverage and improve it’s quality. Sometimes, that already improved runtimes, otherwise it provided a much more stable base to work from for larger changes. A a nice side effect we often managed to reduce the number of lines of code too - through simpler code.
In some ways, that’s what we’re trying to do with SQLFluff anyway: to help you and your teams write cleaner SQL. This is partly to help with communication and understand, but I hope in the process you might find it’s more performant too 😁.

